i am harleen sandhu and i am going to write about how to graph Linear Functions,Quadratic Functions,Cubic Functions,Quartic Functions and Quintic Functions.
LINEAR FUNCTIONS
Definition of Linear Function
- A function that can be graphically represented in the Cartesian coordinate plane by a straight line is called a Linear Function.
More about Linear Function
- A linear function is a first degree polynomial of the form, F(x) = m x + c, where m and c are constants and x is a real variable.
- The constant m is called slope and c is called y-intercept.
Examples of Linear Function
- y = 3x + 5 is a linear function.
- The graph of the function y = 2x is shown below. This is a linear function since the points fit onto a straight line.

Solved Example on Linear Function
Identify the graph that represents a linear function.Choices:
A. Graph 1
B. Graph 3
C. Graph 4
D. Graph 2
Correct Answer: C
Solution:
Step 1: The graph of a linear function is a straight line.
Step 2: Graph 4 is a straight line.
Step 3: So, Graph 4 represents a linear function.

Before graphing QUADRATIC FUNCTIONS we rearrange the equation, from this:
f(x) = ax2 + bx + c
To this:
f(x) = a(x-h)2 + k
Where:
- h = -b/2a
- k = f( h )
In other words, calculate h (=-b/2a), then find k by calculating the whole equation for x=h
First of all ... Why?
|

So ...
- h shows you how far left (or right) the curve has been shifted from x=0
- k shows you how far up (or down) the curve has been shifted from y=0
Lets see an example of how to do this:
Example: Plot f(x) = 2x2 - 12x + 16
First, let's note down:
- a = 2,
- b = -12, and
- c = 16
Now, what do we know?
- a is positive, so it is an "upwards" graph ("U" shaped)
- a is 2, so it is a little "squashed" compared to the x2 graph
Next, let's calculate h:
h = -b/2a = -(-12)/(2x2) = 3
And next we can calculate k (using h=3):
k = f(3) = 2(3)2 - 12·3 + 16 = 18-36+16 = -2
So now we can plot the graph (with real understanding!):

We also know: the vertex is (3,-2), and the axis is x=3
From A Graph to The Equation
What if you have a graph, and want to find an equation?
Example: you have just plotted some interesting data, and it looks Quadratic:

Just knowing those two points we can come up with an equation.
Firstly, we know h and k (at the vertex):
(h, k) = (1,1)
So let's put that into this form of the equation:
f(x) = a(x-h)2 + k
f(x) = a(x-1)2 + 1
Then we calculate "a":
| We know (0, 1.5) so: | f(0) = 1.5 | |
| And we know the function (except for a): | f(0) = a(0-1)2 + 1 = 1.5 | |
| Simplify: | f(0) = a + 1 = 1.5 | |
| a = 0.5 |
And so here is the resulting Quadratic Equation:
f(x) = 0.5(x-1)2 + 1
CUBIC FUNCTIONS
Cubic Functions A quadratic function has the form
Where a, b, c and d are real numbers and a is not equal to 0.
The domain of this function is the set of all real numbers. The range of f is the set of all real numbers. The y intercept of the graph of f is given by f(0) = d. The x intercepts are found by solving the equation
The left hand side behavior of the graph of the cubic function is as follows:
If the leading coefficient is positive, as x increases the graph of f is up and as x decreases indefinitely the graph of f is down.
If the leading coefficient is negative, as x increases the graph of f is down and as x decreases indefinitely the graph of f is up.
Example 1: f is a cubic function given by
- Find the x and y intercepts of the graph of f.
- Find the domain and range of f.
- Sketch the graph of f.
Solution to Example 1
- a - The y intercept is given by
(0 , f(0)) = (0 , 0) - The x coordinates of the x intercepts are the solutions to
x3 = 0 - The x intercept are at the points (0 , 0).
- b - The domain of f (x) is the set of all real numbers.
- Since the leading coefficient (of x3) is positive, the graph of f is up on the right and down on the left and hence the range of f is the set of all real numbers.
- c - make a table of values and graph.
x -2 -1 0 1 2 f(x) = x 3 -8 -1 0 1 8
Also since f(-x) = - f(x), function f is odd and its graph is symmetric with respect to the origin (0,0).
 |
Example 2:if a cubic function given by
- Show that x - 2 is a factor of f(x) and factor f(x) completely.
- Find all zeros of f and their mutliplicity.
- Find the domain and range of f.
- Use the y intercept, x intercepts and other properties of the graph of to sketch the graph of f.
Solution to Example 2
- a - The division of f(x) by x - 2 gives a quotient equal to -x2 - 2x -1 and a remainder is equal to 0. Hence
f(x) = (x - 2)(-x2 - 2x -1) = - (x - 2)(x2 + 2x + 1) = -(x - 2)(x + 1)2 - b - The zeros of f are solutions to
-(x - 2)(x + 1)2 = 0 - Function f has zeros at x = 2 and x = - 1 with multiplicity 2. Therefore the graph of f cuts the x axis at x = 2 and is tangent to the x axis at x = - 1 because the mutliplicity of this zero is even.
- c - The domain of f (x) is the set of all real numbers.
- The leading coefficient f(x) is negative, the graph of f is up on the left and down on the right and hence the range of f is the set of all real numbers.
- d - Properties and graph.
The y intercept of the graph of f is at (0 , 2). The graph cuts the x axis at x = 2 and is tangent to it at x = - 1. Adding to all these properties the left and right hand behavior of the graph of f, we have the follwoing graph.
QUARTIC FUNCTION
In mathematics, a quartic function, or equation of the fourth degree, is a function of the form

where a is nonzero; or in other words, a polynomial of degree four. Such a function is sometimes called a biquadratic function, but the latter term can occasionally also refer to a quadratic function of a square, having the form

or a product of two quadratic factors, having the form

Setting  results in a quartic equation of the form:
results in a quartic equation of the form:
where a ≠ 0.
The derivative of a quartic function is a cubic function.
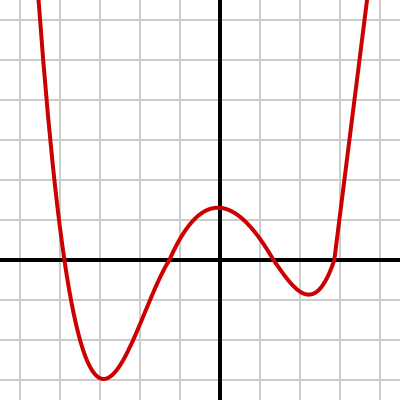
Since a quartic function is a polynomial of even degree, it has the same limit when the argument goes to positive or negative infinity. If ais positive, then the function increases to positive infinity at both sides; and thus the function has a global minimum. Likewise, if a is negative, it decreases to negative infinity and has a global maximum.
The quartic is the highest order polynomial equation that can be solved by radicals in the general case (i.e., one where the coefficients can take any value).
QUINTIC FUNCTIONS
In mathematics, a quintic function is a function of the form


where a, b, c, d, e and f are members of a field, typically the rational numbers, the real numbers or the complex numbers, and a is nonzero. In other words, a quintic function is defined by a polynomial of degree five.
Setting g(x) = 0 and assuming a ≠ 0 produces a quintic equation of the form:
If a is zero but one of the other coefficients is non-zero, the equation is classified as either aquartic equation, cubic equation, quadratic equation or linear equation.
Because they have an odd degree, normal quintic functions appear similar to normal cubic functions when graphed, except they may possess an additional local maximum and local minimum each. The derivative of a quintic function is a quartic function.

I hope u guys enjoyed and learned something from the information given above,Good Luck:)
No comments:
Post a Comment